Importing many batches / curves with meta information
Pro Importing batches / curves with meta info is only available in Visplore Professional.
In addition to numerical and categorical data columns, a unique feature of Visplore’s data model is representing curve-typed data columns in a table. Similar to "nested" arrays/lists in other environments, curve-typed columns hold an entire curve (=value vector) in each table cell. These curves can be visualized in Visplore Professional, and correlated with other information. This discrete data model has advantages for many use cases with large numbers of curves. Examples are:
- Analyzing batches together with meta-information per batch (e.g. for predictive quality). Each row of the data table refers to one manufactured batch. For each batch, KPIs (like quality) or other meta info (like product type) are represented as numerical/categorical columns. In addition, one or multiple time series per batch are represented as curves (e.g. pressure, temperature, or a chemical element’s amount over time).
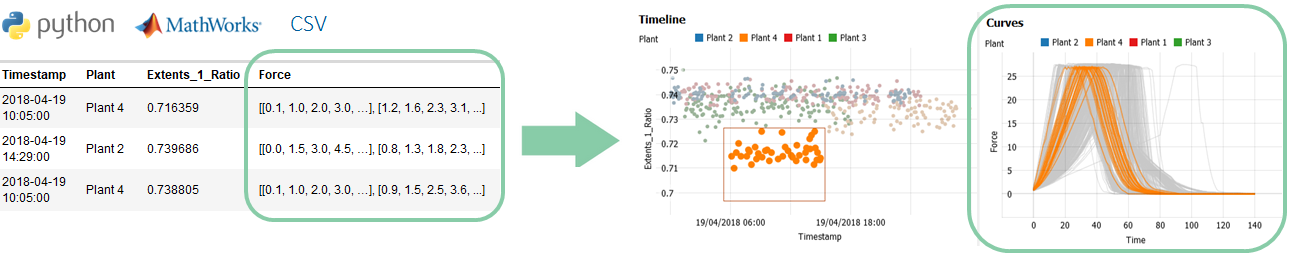
- Analysis (or labeling) of machine operations, such as press strokes, shot curves, milling operations, bolt tightenings, etc. Each table row is one operation with meta information columns, and time series as curves per operation – such as force over time (see example image above).
- A large number of experiments in R&D. Each experiment is a row with numeric/categorical input/control parameters and result measurements. In addition, curves can hold measured time series or a spectrum for each experiment.
- Simulation results of a multi-run simulation / DoE. One simulation run per row with numerical and categorical input parameters that can be related to numerical or curve-typed simulation results (e.g. torque or acceleration as a function of angle or time).
This unique data model supports a joint analysis of the curves with meta-information, as described in detail in the "Analyzing many batches / curves" documentation chapter.
This chapter describes, how you can import a data table with curve-typed columns from various data sources. In particular, from Python, Matlab, and CSV files.
Importing curve-typed data from Python
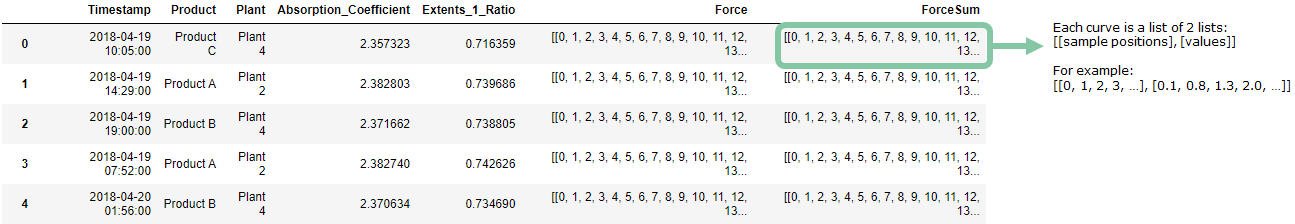
To import curve-typed data from Python, the data needs to be in Pandas DataFrame format, where the cells hold the curves as nested lists. In the example below, Force and ForceSum are two curve-typed attributes:
Note: you can download a Jupyter Notebook featuring this dataset, to try this on your own.
To correctly import curve-typed data to Visplore, the format of the curve-typed columns need to meet the following requirements:
- In every row of a curve-typed column: a curve is represented as a list of two lists. The first list is holding the sample locations, and the second holds the curve values for these locations. Both the sample locations and the curve values must be numerical type. Typical sample locations are relative times (e.g. seconds passed since the beginning of batch), angles passed, or frequencies in a curve representing a spectrum. Note that the list of sample locations *must* be provided. If your experiment/batch does not have sample locations, please provide a list of increasing indices [0,1,2,...], with a length corresponding to the number of curve values in the second list.
- The sample locations do NOT need to be equally spaced. Sampling can be irregular. However, they have to be strictly monotonous (i.e., increasing from left to right).
- Each row can have a curve of a different length. However, the number of sample locations and sample values within each individual curve must match.
- There can be more than one curve-typed column (as in the example above). The lengths of the curves can be different for each column.
- A curve can be missing for some rows. In this case, just represent it as numpy.nan. However, a sample within a curve can not have missing values. In this case, just omit the sample from the curve altogether.
Once you have your data in the correct Pandas DataFrame format, you can send it to Visplore using the "send_data" command of our Python API. Note the following:
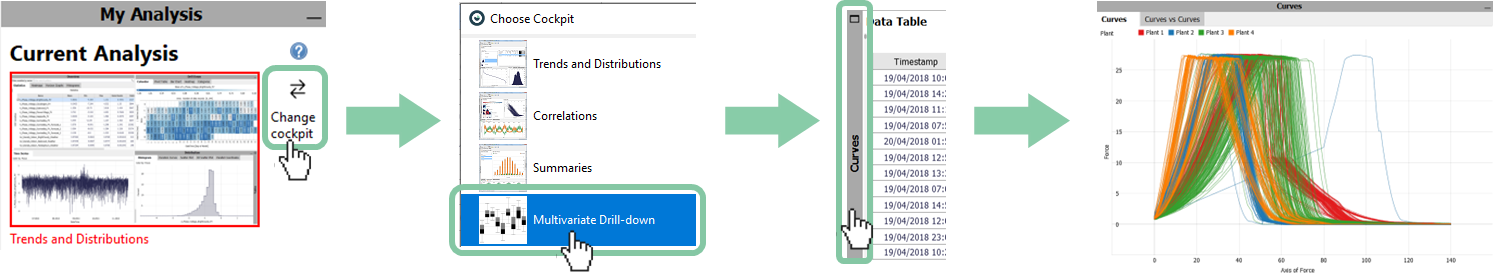
- Important: Use the "Multivariate Drill-down cockpit" in Visplore Professional, to look at the curves. Other cockpits, such as Trends and Distributions, can’t visualize curves. In Multivariate Drill-down, open the "Curves" view to look at one curve-typed column at a time.
- Sending curve-typed data from Python may take long – consider trying it out with a small number of rows (=batches) first.
- In case of a timeout / large memory consumption in Python, you can process and send the data in chunks to Visplore (see the "replace" and "append" parameters of the "send_data" command, for appending something like 1000 rows to a Visplore table at a time).
Some things you can do with curved-typed data in Visplore:
- Selecting curves and seeing how the KPIs, etc. are distributed. You can do this by dragging a line with the left mouse button in the "Curves" view.
- Labeling curves.
- A lot more analysis as described in the "Analyzing many batches / curves" chapter.
- Export a selection of curves back to Python using get_selection() or get_classification("Labeling 1") commands, as shown in the video for labeling curves (see previous item).
- Note: to enable end-users to load curve-typed data without Python, we can help you set up a custom connector. Please contact us for more details.
Importing curve-typed data from Matlab
Importing curve-typed data from Matlab has very similar requirements as the import from Python, thus please also see the section about Python above for the general workflow. In the following, only the Matlab specifics and the differences over Python are described.
- In general, tables or timetables are tabular structures that can be sent to Visplore (similar to Pandas data frames in Python).
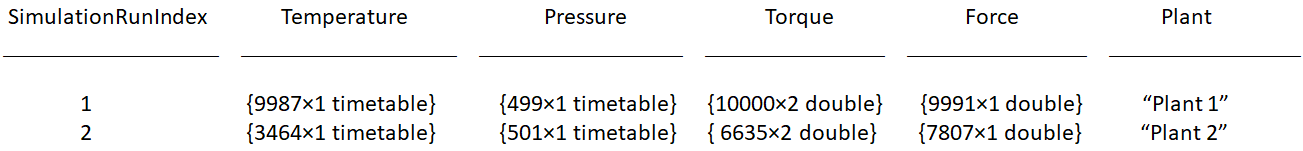
- A curve can be a cell in a table, that contains an Nx1/1xN single array or Nx2/2xN double array. If it's a one-dimensional array, then the sample locations are automatically added as index values (1-N). In a two-dimensional array, the first column defines the sample locations, and the second the curve values for these locations. The number of sample locations and curve values must be identical.
- Storing each curve as a timetable is also supported (=nested timtable), where the time axis represents the sample locations and the single remaining column defines the curve values. Note that in Visplore the time index is converted into a duration automatically. If you have timestamps, we suggest to store the time axis as durations (real-valued numbers) in each curve.
- Currently, there is no support for representing each curve as table. Timetables do work, but regular tables don't.
- Currently, there is no support in Matlab for missing values within curves (which would be represented as NaN). Missing curves are also not supported, thus NaN also can't stand as a replacement for a curve in a table.
In the below example, every cell of the table is a curve except the cells in the SimulationRunIndex and Plant columns.
Once you have your data in the correct format in Matlab, you can send it to Visplore using the "send_data" command of our Matlab API. Note the following:
- Important: Use the "Multivariate Drill-down cockpit" in Visplore Professional, to look at the curves. Other cockpits, such as Trends and Distributions, can’t visualize curves. In Multivariate Drill-down, open the "Curves" view to look at one curve-typed column at a time.
- Sending curve-typed data may take long – consider trying it out with a small number of rows (=batches) first.
- In case of a timeout / large memory consumption in Matlab, you can process and send the data in chunks to Visplore (see the "replace" and "append" parameters of the "send_data" command, for appending something like 1000 rows to a Visplore table at a time).
Importing curve-typed data from multiple CSV files
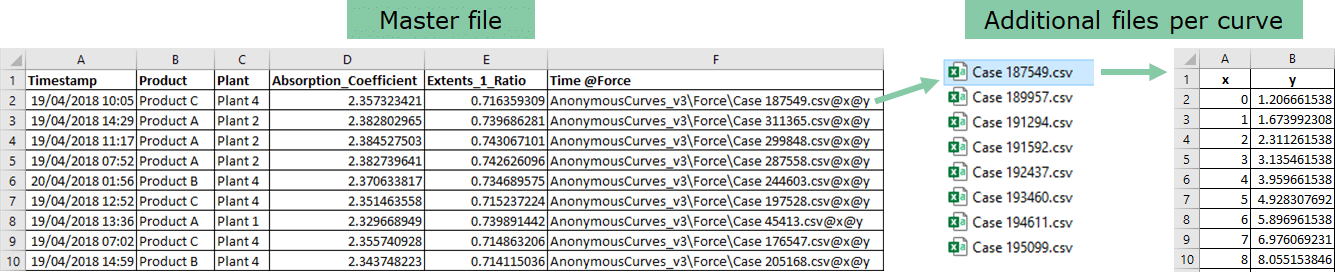
You can also import curve-typed data to Visplore from CSV files, without Python or Matlab. For example, if you have one CSV file per operation pattern. To do this, you need a particular CSV file structure. First of all, you need a "master file" where you have one row per batch (or per operation, simulation run, experiment, ...). This "master file" can hold references to additional CSV files holding the curves of a particular batch/operation/simulation/experiment. Each additional CSV file must have at least 2 columns, one for the axis and one for the values of the curve.
Further details about the requirements of the CSV file structure:
- The "master file" CSV can contain one or multiple columns linking to curve files (the "curve columns").
- Each curve column needs to have a column name (=header) of the format <axisname>@<valuename>. For example, Time@Force would express the time series is called "Force", and its sample locations are labeled "Time" when plotted in Visplore.
- Per row, a curve column contains a link to an additional file holding the sample locations and corresponding values. The link has to be of the format <filepath\name.csv>@<axiscolumn_name>@<valuecolumn_name>, for example AnonymousCurves_v3\Force\Case 1221.csv@x@y.
- The path to the filename is relative to the master CSV table’s file location and can be omitted if no subfolder structure is used.
- Regarding the additional CSV files per curve:
- Each of them must have at least 2 columns. One for the axis, and one for the values of the curve. In the above example, the sample locations are in a column called x, and the corresponding values are in column y. Note that these names are not visible in Visplore afterward, only used to express the linking.
- These columns must be numerical, and can not contain missing values. In case of a missing sample, don’t put a sample location either.
- Just as for Python and Matlab, curves can be of different lengths (=number of samples) and don’t need to be regularly sampled. Also, each curve can have different sample locations.
- Pro tip: an additional file can also contain more than 2 columns if many curves share the same sample locations as axis. For example, if 10 different signals are measured at the same times, all 10 columns (e.g. y1, y2, …, y10) can be put in the same additional file, next to one shared axis column, e.g. named x. In this case, the master table would have 10 curve-link columns, linking to the same file.csv@x but to different @y1,..,@y10. But this is purely optional, for avoiding repetition. You can just as well link to 10 files for this purpose.
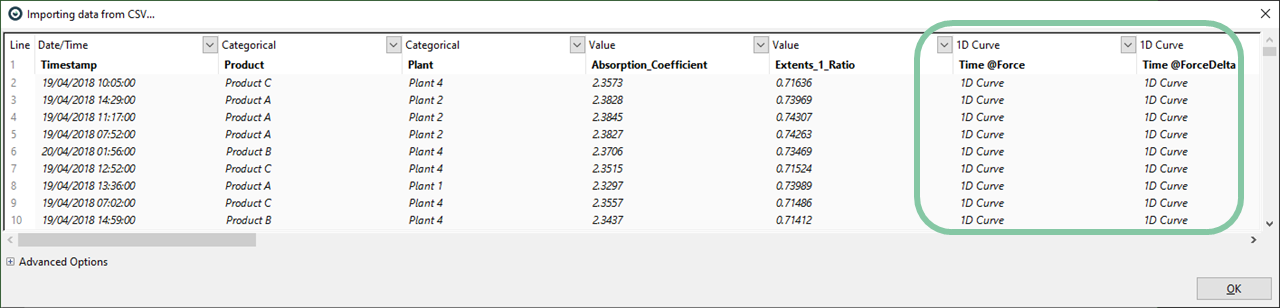
- To load CSV files with curves in Visplore, just select the "master file" as the CSV file to load.
- Make sure, all curve-typed columns are recognized as such using the preview dialog of the CSV import.
- Use the "Multivariate Drill-down cockpit" in Visplore Professional, to look at the curves. Other cockpits, such as Trends and Distributions, can’t visualize curves. In Multivariate Drill-down, open the "Curves" view to look at one curve-typed column at a time.
Note: the "Batch Production Quality" demo dataset shipped with Visplore Professional was created with the required CSV file structure, and you can check how this data looks in Excel. You can find the CSV files in your Visplore installation folder, in the "...\Data\Production\" subfolder.
Great! You have learned how to make use of Visplore's unique data model to import large numbers of curves! Please refer to our upcoming chapter of "Analyzing curve-typed data" to learn how to address typical use cases with this kind of data. As one example, labeling machine operations can already be found here.