Documenting and sharing the analysis
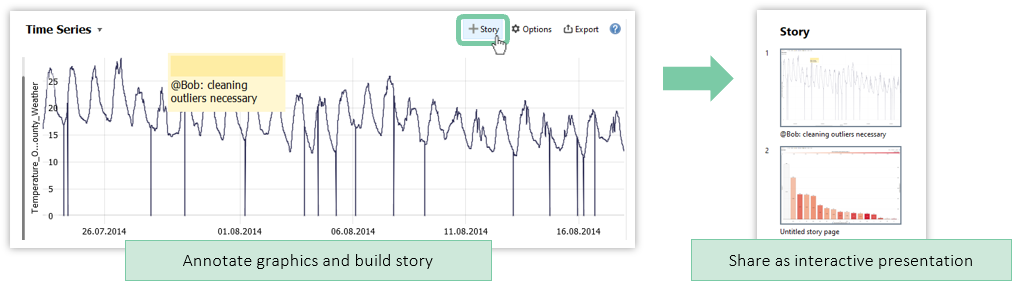
Often you want to document or share your graphics and insights with others. For this, you can capture Visplore elements as story pages, and add annotations for your colleagues.
Use story pages for the following:
- Document analysis steps for transparency and reproducability, e.g., which data has been filtered or edited, newly calculated, and what were the findings.
- Tell a story that can be shared as a deliverable, and consumed even in Visplore Free without a license.
- Prepare data presentations that can be discussed interactively with customers.
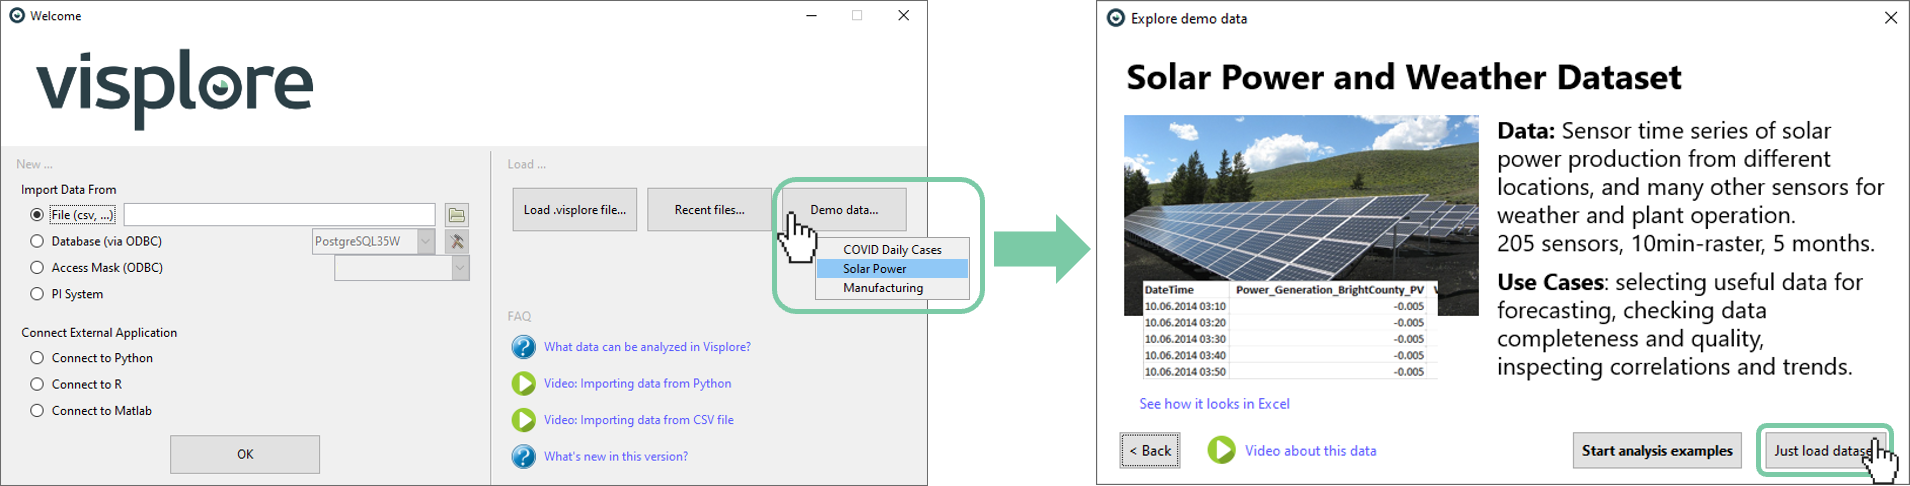
Preparation (to follow this lesson using demo data)
For the tutorial, load the solar power demo dataset from the welcome dialog, as shown below.
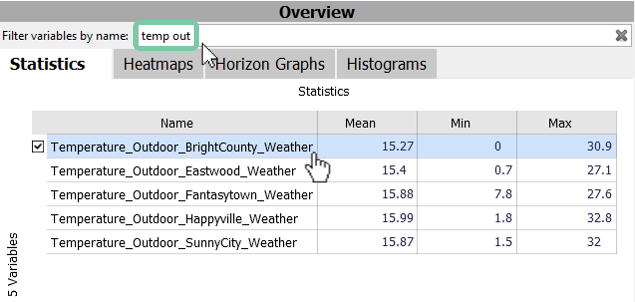
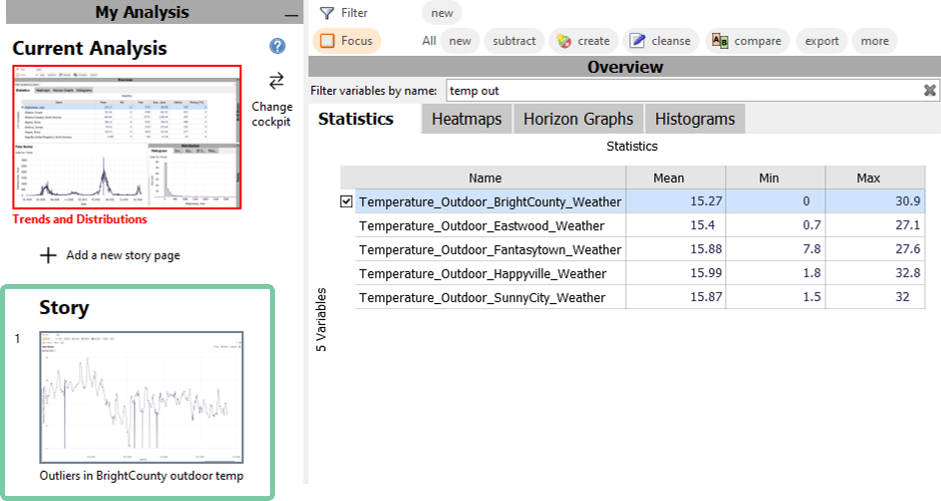
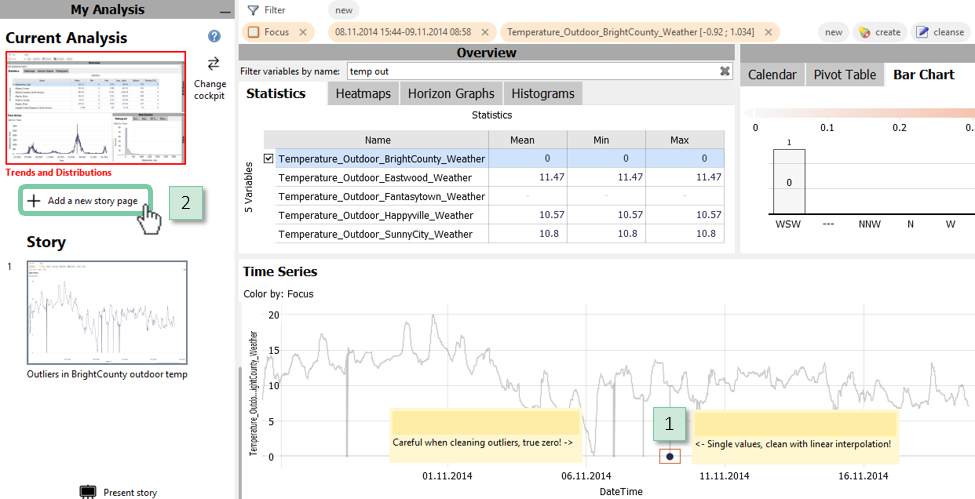
Choose the 'Temperature_Outdoor_BrightCounty_Weather' time series. You can find it by entering 'temp out' in the filter above.
Creating a story page
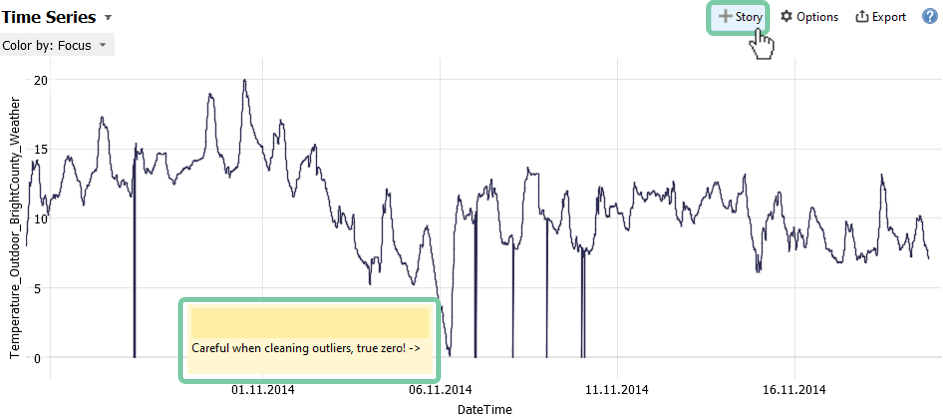
Create a story page to document your first finding. The temperature readings clearly show outliers.
Zoom in to your temperature readings for details. Then create a story page by clicking "Story".
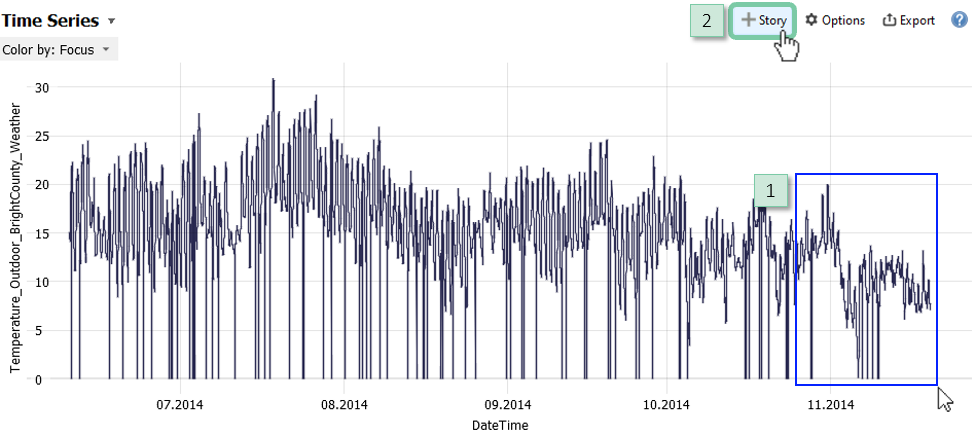
Enter a title to describe your finding, such as "Outliers in BrightCounty outdoor temperature".
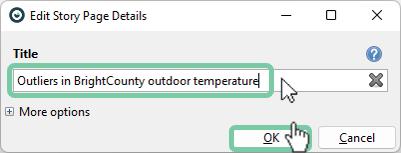
Note: You can optionally enter a longer description of your finding. Also, you can adjust the visible elements in your story page and other adjustments. You get these options by clicking on "More options".
You see your newly documented finding in the "My analysis" section and remain in your current cockpit. You can now switch between your finding of story page 1 and your "Current Analysis". The current view is highlighted in red color.
Creating annotations
Use annotations in the form of sticky notes to comment on your observations right beside where you see them.
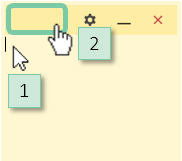
Click on the first icon  in the toolbar section "Sticky notes".
The click creates a new sticky note in the center of your screen. Comment on your finding, and then reposition the sticky note by dragging the dark yellow area into your "Time Series" view.
Note: Sticky notes belong to the view underneath their top-left corner (anchor point), and are positioned relative to this view's size - for example when resizing the view.
Create a new story page containing your new annotation.
Pages with multiple views
Pages can contain multiple views. To create a story page with multiple views, best use the "Add a new story page" option in the "My Analyis" pane.
Highlight a single outlier with the left mouse button in the "Time Series" view. Add another sticky note by clicking the icon . Input a description and position it as seen below.
Create a new story page containing your new annotation by clicking "Add a new story page".
In the dialog, enter a speaking title of your finding, such as "Outliers single values". Pick the elements you want to see in your story page by selecting "Time Series" and "Focus data records" in "Other Elements".
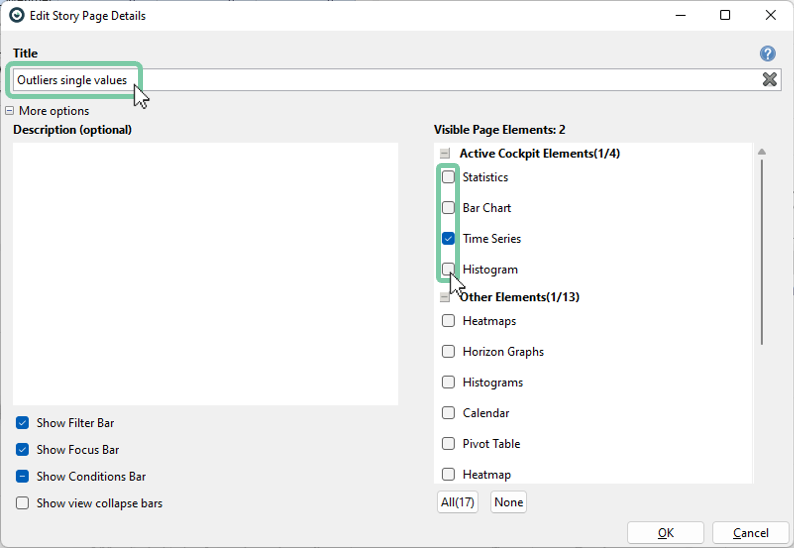
Note: The "Add a new story page" by default contains all visible elements of the current view. Visible elements can be freely adjusted using the checkboxes. The filter bar, the focus bar, and the conditions bar (if conditions are available) are also displayed by default but can be deselected for simplification.
Editing a page
Edit a story page should you decide to e.g. add or remove elements or change the description.
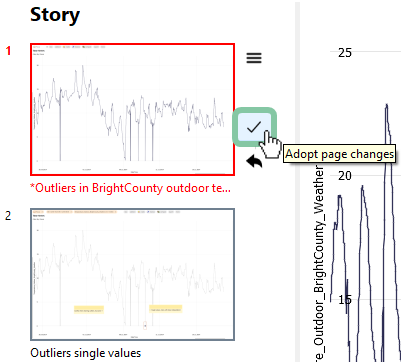
Open the first page by simply clicking on the story page as you would when changing a slide in PowerPoint. The new active story page is now highlighted in red.
Zoom out to show more outliers.
Click the checkmark symbol next to the page to save the page changes, if you are happy with the change. Alternatively, you can revert the changes with the arrow symbol.
To continue your analysis, exit the current page by clicking the "Trends and Distributions" preview image. It is labeled "Continue Analysis" in the "My Analysis" pane.
Sharing stories
You can share your stories as an interactive ".visplore" file Pro. The stories can also be consumed with Visplore Free, meaning that the one you share your analysis with does not need a Visplore license!
Save the story by clicking on the "Save cockpit configuration" icon. Select where you want to save the story and confirm with "OK".
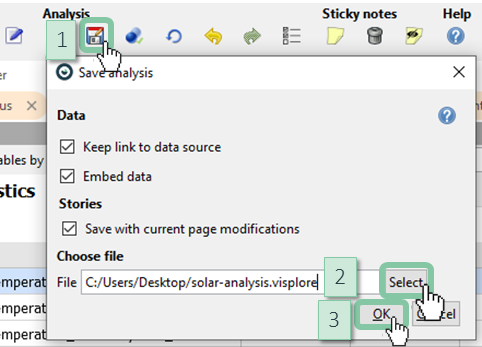
Note: See a description of all saving options in chapter Saving and Loading the Analysis.
General remarks
You can combine different cockpits into one story by clicking "Change cockpit".
Story pages can contain different datasets. Use "Import data" and choose not to reset the current story.
Use  "Present story" to enter the focussed presentation mode without all the icons, similar to PowerPoint.
Use  "Export" to create a PDF of your story. See the use case tutorial Creating regular reports for details.
Great! You now know how to create stories and share them.
>> Continue with Next lesson: Exporting images and data
License Statement for the Photovoltaic and Weather dataset used for Screenshots:
"Contains public sector information licensed under the Open Government Licence v3.0."
Source of Dataset (in its original form): https://data.london.gov.uk/dataset/photovoltaic--pv--solar-panel-energy-generation-data
License: UK Open Government Licence OGL 3: http://www.nationalarchives.gov.uk/doc/open-government-licence/version/3/
Dataset was modified (e.g. columns renamed) for easier communication of Visplore USPs.